Turning Data into Insights: How to Visualize Your Skykit Beam Proof of Play Report
After you’ve successfully downloaded your Skykit Beam Proof of Play report, looking at a massive spreadsheet of raw data can be confusing.
Using Google Looker Studio (a powerful, free data visualization tool), you can transform your raw data into clear, actionable visual graphs. All you need is a standard Google account.
Here is your step-by-step guide to bringing your Proof of Play data data to life. This guide will walk you through the steps needed to create compelling visual representations of your data.
Step 1: Download Your Report from Skykit Beam
Before you can visualize your data, you need to grab it from the source.
Log into your Skykit Beam account.
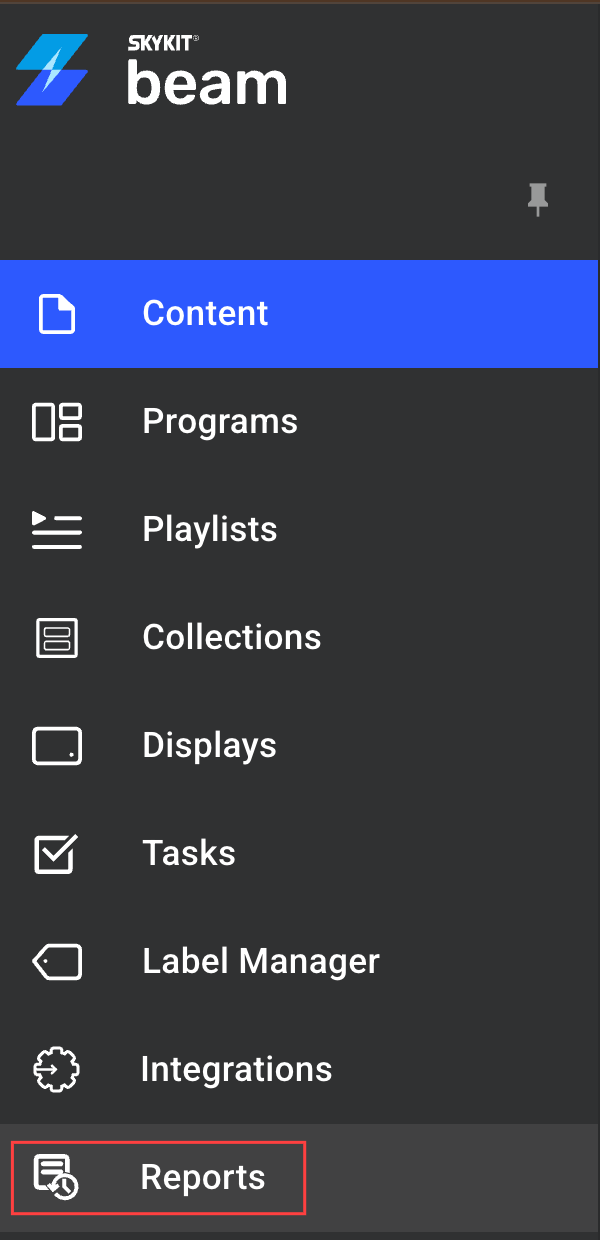
In the left-hand navigation menu, select the Reports option.
Locate your specific Proof of Play report from the list.
Click the Download button to save the file (usually a CSV or Excel file) to your computer.
.png)
Step 2: Upload Your Data to Google Looker Studio
Now that you have your data file, it’s time to move it into Looker Studio.
Navigate to datastudio.google.com and log in with your Google account.
Click the + Create button in the upper-left corner and select Report from the dropdown menu.
.png)
You will be prompted to connect a data source. In the search bar, type "Upload" and select the File Upload option.
.png)
.png)
First-Time User Note
If this is your first time using Looker Studio, Google may ask you to authorize a connection with Google Cloud Storage and sign in with your Google profile. Follow the quick on-screen prompts to grant permission.
Click to upload the Skykit Beam Proof of Play report you downloaded in Step 1.
Once the file finishes uploading and shows a green "Uploaded" status, click the Add button in the bottom right-hand corner.
.png)
Confirm by clicking Add to Report on the final prompt.
Step 3: Build Your Visual Dashboard
It is time to turn those numbers into visuals. Looker Studio will open a blank canvas with your Skykit data loaded in the right-hand panel.
Organize General Information
Start by ensuring Looker Studio is pulling the correct metrics. Look at the Data pane on the right side of your screen. Ensure your Skykit spreadsheet is selected as the primary data source. You can drag and drop specific fields—like Content Name, Screen/Player Name, Timestamp, and Play Duration—into your setup panel.
Add Visual Graphs
Utilize the visual elements provided by Looker Studio to make your report both informative and visually appealing.To see which content is actually performing best, you need charts.
How to add a chart: Click Add a chart in the top toolbar.
Recommended Visuals for Proof of Play: Bar Chart, Pie Chart or a Time series graph
Once you select a chart, click anywhere on your blank canvas to drop it into place. Looker Studio will automatically attempt to populate it. You can refine what the graph shows by tweaking the Dimension (e.g., Content Name) and Metric (e.g., Record Count or Total Plays) in the properties panel on the right.
The Result: Smarter Signage Decisions
By spending just a few minutes connecting Skykit Beam to Looker Studio, you transform raw compliance logs into a professional presentation. You can now see exactly which screens are pulling the most weight, and optimize your content schedule based on hard evidence.
FAQs
What is Looker Studio?
Looker Studio is a free tool powered by Google that helps users visualize their data.How do I download my Proof of Play report?
To download your Proof of Play report, navigate to the Reports page in your Skykit Beam account and click the Download button.How do I download my Proof of Play report?
To download your Proof of Play report, navigate to the Reports page in your Skykit Beam account and click the Download button.What steps should I follow to upload my report to Looker Studio?
First, go to the Looker Studio website, click the +Create button, select Report, then search for 'Upload' and choose the File Upload option to upload your report.Do I need to authorize Looker Studio before using it?
Yes, if you are using Looker Studio for the first time, you will need to authorize Google to sync with Google Cloud Storage.How can I create visual graphs in Looker Studio?
After uploading your data source, you can create visual graphs by selecting the appropriate visual elements provided by Looker Studio.